Exploring countries
Let’s have a high-level overview of the distributions in our data.
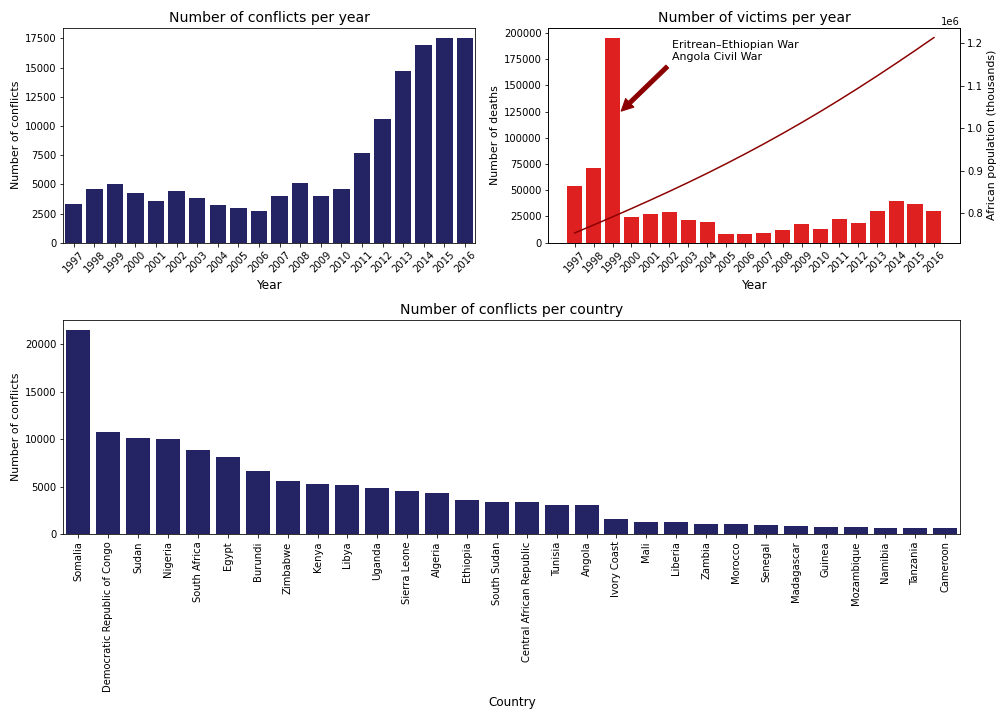
From the above summary we can observe few things. First of them is a sudden increase in the number of conflicts after 2010 which can be associated with the Arab Spring and the rise of violent Islamist terrorism in Africa, peaking in 2015 before starting to decline [1]. Unfortunately, what can also be noticed is that a more than threefold increase in the number of events resulted in a similar scale of increase in the number of fatalities.
Another thing that cathes the eye is the unexceptionally high number of casualties in 1999. The events that mainly contributed to this number are Erithrean-Ethiopian War (77 035 deaths in Erhitrea and 26 421 in Ethiopia) that took place between May 1998 to June 2000 and Angola Civil War (73 979 deaths), beginning in 1975 and continuing until 2002. Also, this plot shows how the number of fatalities compares to the increasing African population.
Finally, a country with the highest number of conflicts since 1997 (twice as many as the second country in this ranking) is Somalia. This country suffers from an ongoing civil war that started and 1991 and continues to this very day.
But what if we could see how the situation looked like in each of the countries?
Interactive barplots with a number of conflicts or number of fatalities give us the possibility to see how conflicts and deaths are distributed during the time, how the situation looks like in different countries, and which type of conflicts are the most common.
Both visualizations with a possibility to select a country give us an opportunity to investigate the situation in one specific country in which we are interested the most. Each of the users can have their own interests and knowledge, thus, they can pick what to look at and interpret in their own way.
Nevertheless, we have our conclusions and we propose to explore for instance: Angola, Chad, and Egypt. In the case of Angola we can easily see the battle in 1999. Both the number of events and the number of victims is high in this particular year. This is the next example when we see the effect of the Angola Civil War. While looking at Chad we also observe a high increase of cases in type Battle-No change of territory from the year 2005 which decrease after 2009. Thus we can assume the war in these years. After checking Chadian Civil War we can say that our assumption agrees with reality. The situation in Egypt looks slightly different and we can not investigate any wars there but we can see a big rise in 2010 in the case of Riots/Protests. The position of Egypt looks peaceful for almost 15 past years and that it changed dramatically as a result of anti-government protests against the poor material situation, restriction of civil rights and the long rule of President Husni Mubarak.